
 Australia Employment Change 18 May 2017
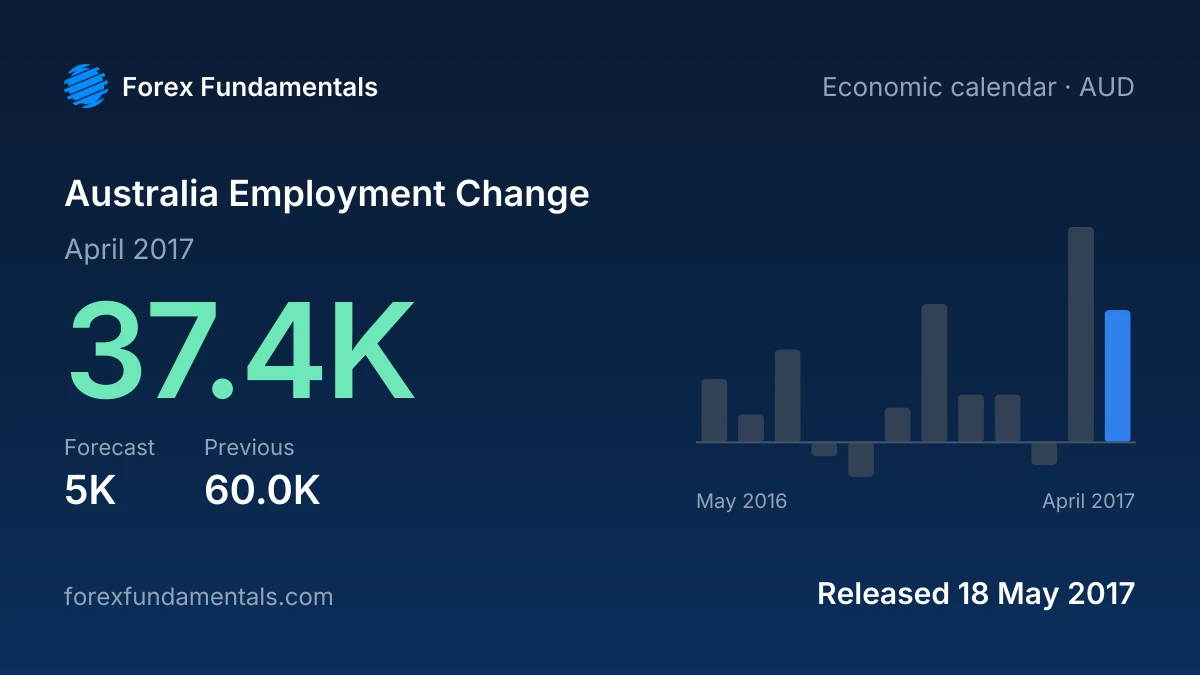
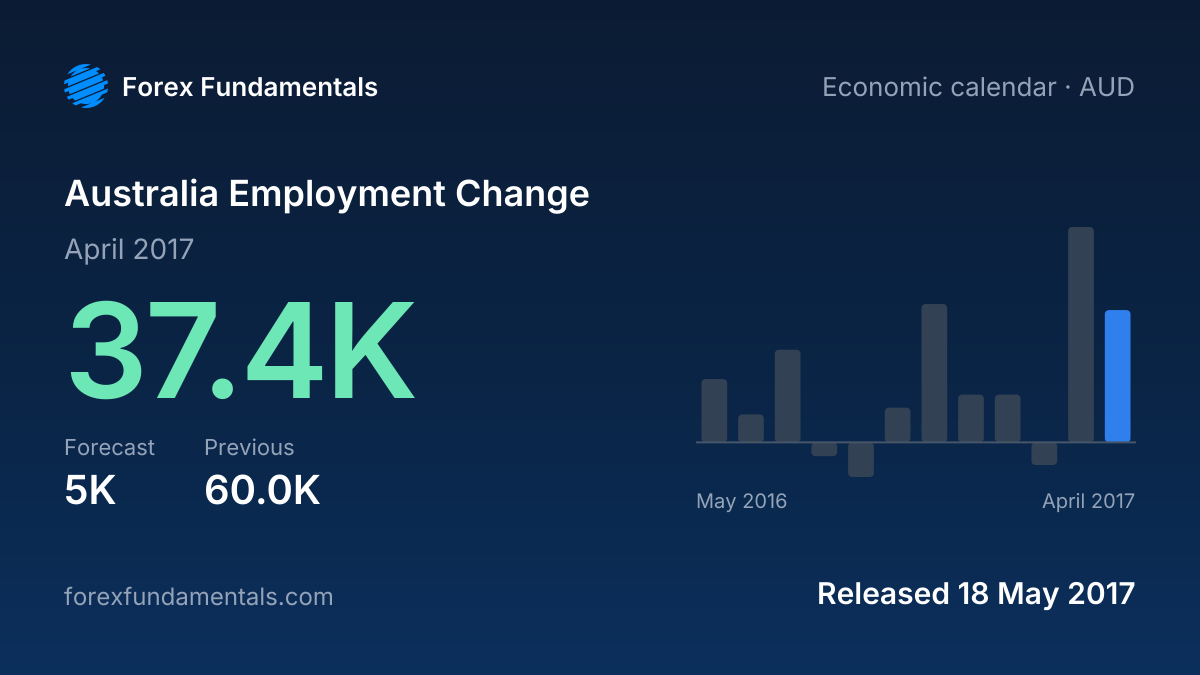
: 37.4K for April 2017, above the 5K forecast and against 60.0K in March 2017 (first reported as 60.9K). It is the second release in a row above the forecast. It was released on Thu 18 May 2017 at 01:30 UTC.
These figures were verified on 4 Oct 2026 from the source: Australian Bureau of Statistics. This page reports the release as published: the figures, the consensus forecast and what a print like it usually does to the currency.
What a print like this usually does
Above the forecast: A strong employment gain can support the Australian dollar as markets see less reason for the RBA to cut rates, especially if full-time jobs also rise.
Cite this release
If you cite this release, please link to this page:
Australia Employment Change 18 May 2017: 37.4K vs 5K forecast (Australian Bureau of Statistics). Forex Fundamentals, https://forexfundamentals.com/economic-calendar/au-employment/2017-05-18