
 UK Core Inflation Rate 12 September 2017
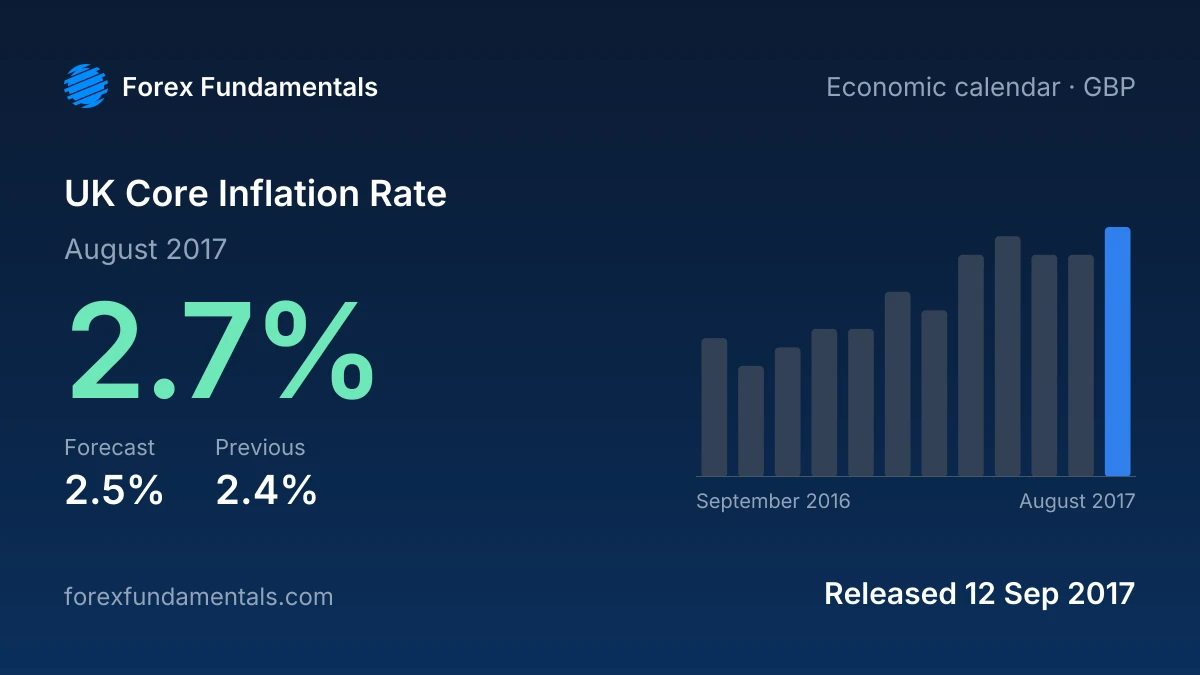
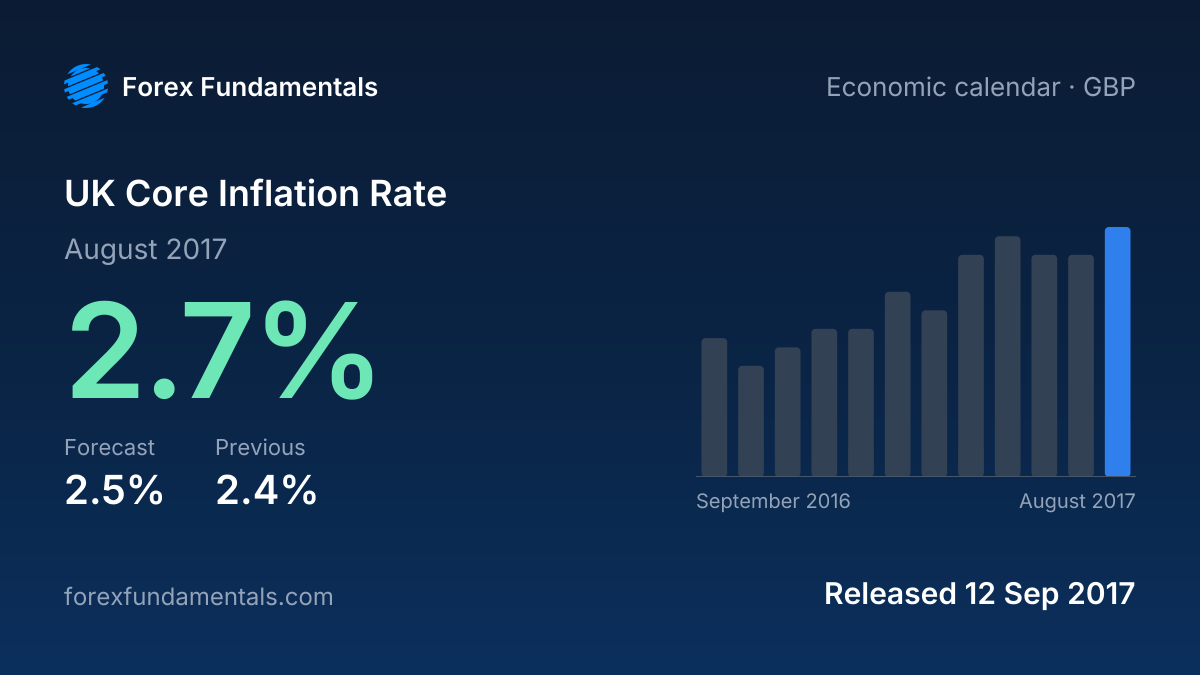
: 2.7% for August 2017, above the 2.5% forecast and up from 2.4% in July 2017. It is the highest of the last 12 releases. 7 of the last 12 releases came in above the forecast. It was released on Tue 12 Sep 2017 at 08:30 UTC.
These figures were verified on 4 Oct 2026 from the source: Office for National Statistics. This page reports the release as published: the figures, the consensus forecast and what a print like it usually does to the currency.
What a print like this usually does
Above the forecast: A beat can support sterling as markets see underlying inflation as harder to bring down and price a tighter BoE path.
Cite this release
If you cite this release, please link to this page:
UK Core Inflation Rate 12 September 2017: 2.7% vs 2.5% forecast (Office for National Statistics). Forex Fundamentals, https://forexfundamentals.com/economic-calendar/uk-core-cpi/2017-09-12