
 UK Retail Sales 19 October 2017
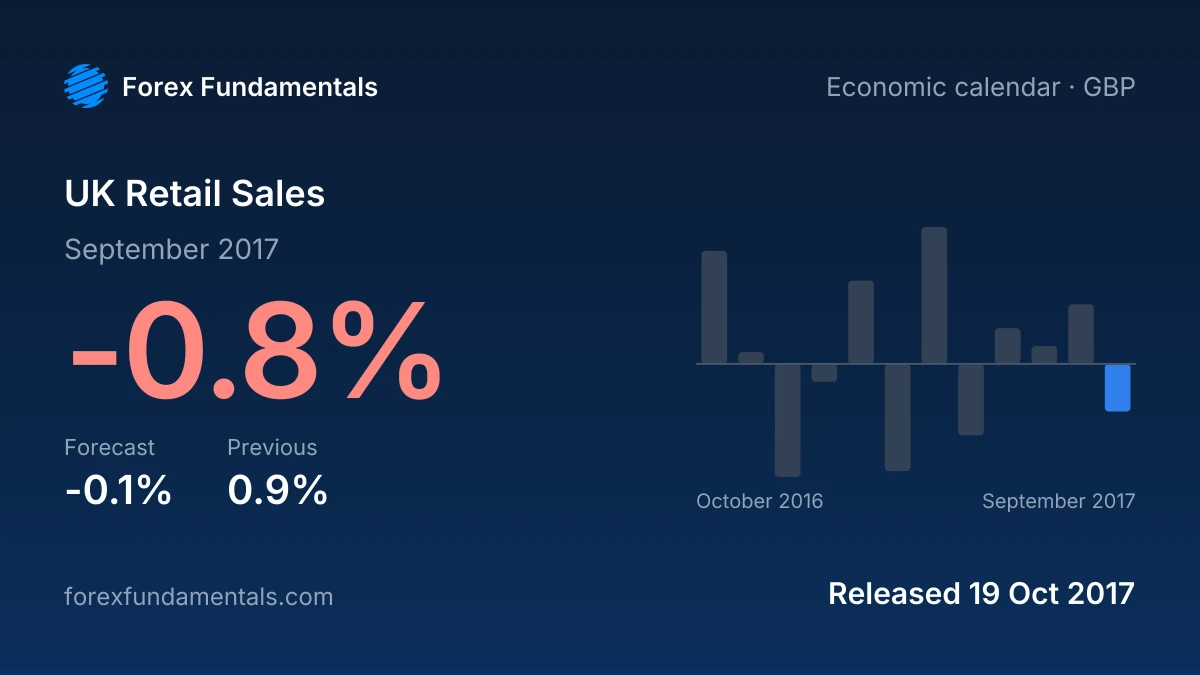
: -0.8% for September 2017, below the -0.1% forecast and against 0.9% in August 2017 (first reported as 1%). It is the lowest reading since May 2017. 5 of the last 12 releases came in below the forecast. It was released on Thu 19 Oct 2017 at 08:30 UTC.
These figures were verified on 4 Oct 2026 from the source: Office for National Statistics. This page reports the release as published: the figures, the consensus forecast and what a print like it usually does to the currency.
What a print like this usually does
Below the forecast: A reading below forecast would usually weigh on sterling as a sign of weaker consumer demand. The downside is more likely to persist if other UK activity indicators are also soft.
Cite this release
If you cite this release, please link to this page:
UK Retail Sales 19 October 2017: -0.8% vs -0.1% forecast (Office for National Statistics). Forex Fundamentals, https://forexfundamentals.com/economic-calendar/uk-retail-sales/2017-10-19