US Core PCE Price Index

US Core PCE Price Index 1 May 2017

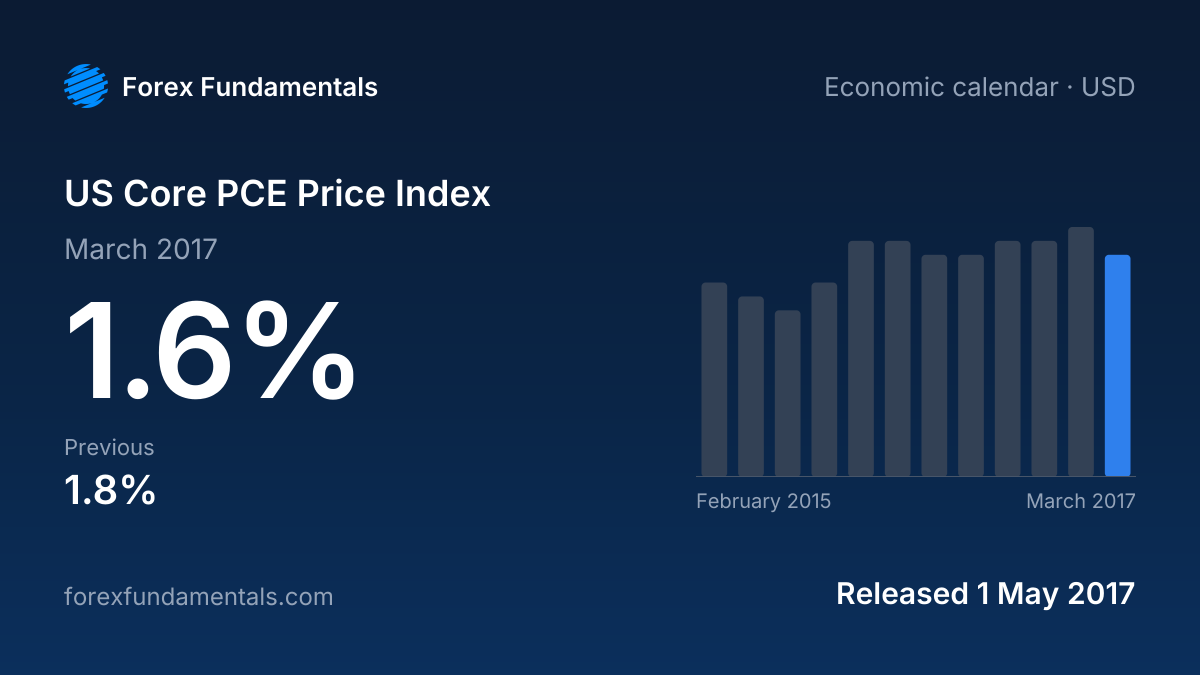
US Core PCE Price Index 1 May 2017: 1.6% for March 2017, down from 1.8% in February 2017. It is the lowest reading since April 2016. It was released on Mon 1 May 2017 at 12:30 UTC (8:30 AM ET).

These figures were verified on 4 Oct 2026 from the source: U.S. Bureau of Economic Analysis. This page reports the release as published: the figures.

Actual
1.6%
March 2017
Forecast
—
The market consensus
Previous
1.8%
As the source gives it
US Core PCE Price Index 1 May 2017: 1.6% for March 2017, with the last 12 releases
Sharing this? Please link to this page as the source.Download the chart

Cite this release

If you cite this release, please link to this page:

US Core PCE Price Index 1 May 2017: 1.6% (U.S. Bureau of Economic Analysis). Forex Fundamentals, https://forexfundamentals.com/economic-calendar/us-core-pce/2017-05-01

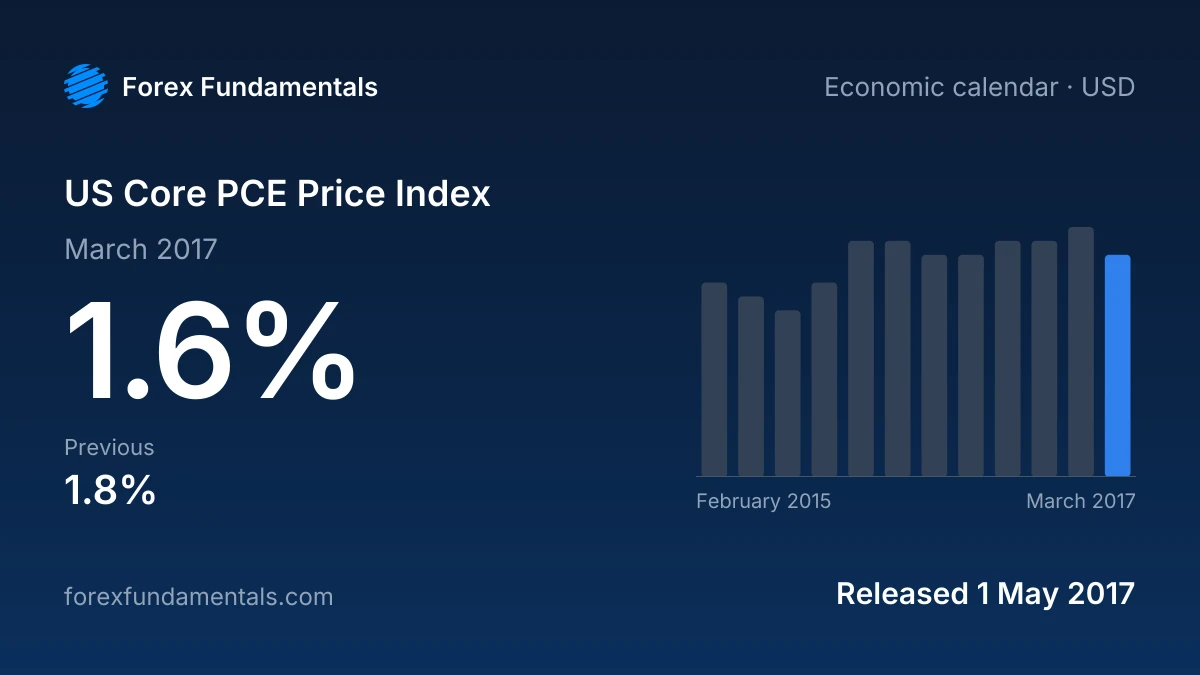
The last 12 releases · times in UTC
ReleasedForActualForecastPrevious
1 May 2017Mar1.6%—1.8%
31 Mar 2017Feb1.8%1.7%1.8%
1 Mar 2017Jan1.7%1.8%1.7%
30 Jan 2017Dec1.7%1.7%1.7%
31 May 2016Apr1.6%—1.6%
29 Apr 2016Mar1.6%—1.7%
28 Mar 2016Feb1.7%—1.7%
26 Feb 2016Jan1.7%—1.5%
1 Feb 2016Dec1.4%—1.4%
1 Jun 2015Apr1.2%—1.3%
30 Apr 2015Mar1.3%—1.4%
30 Mar 2015Feb1.4%—1.3%