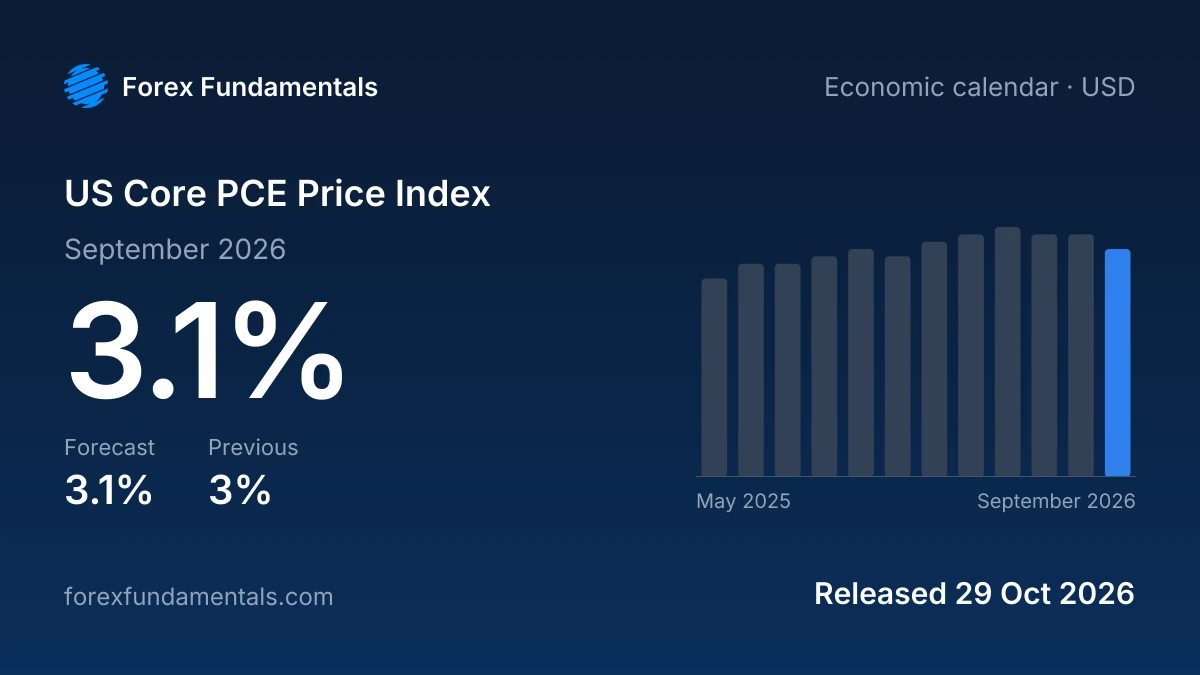
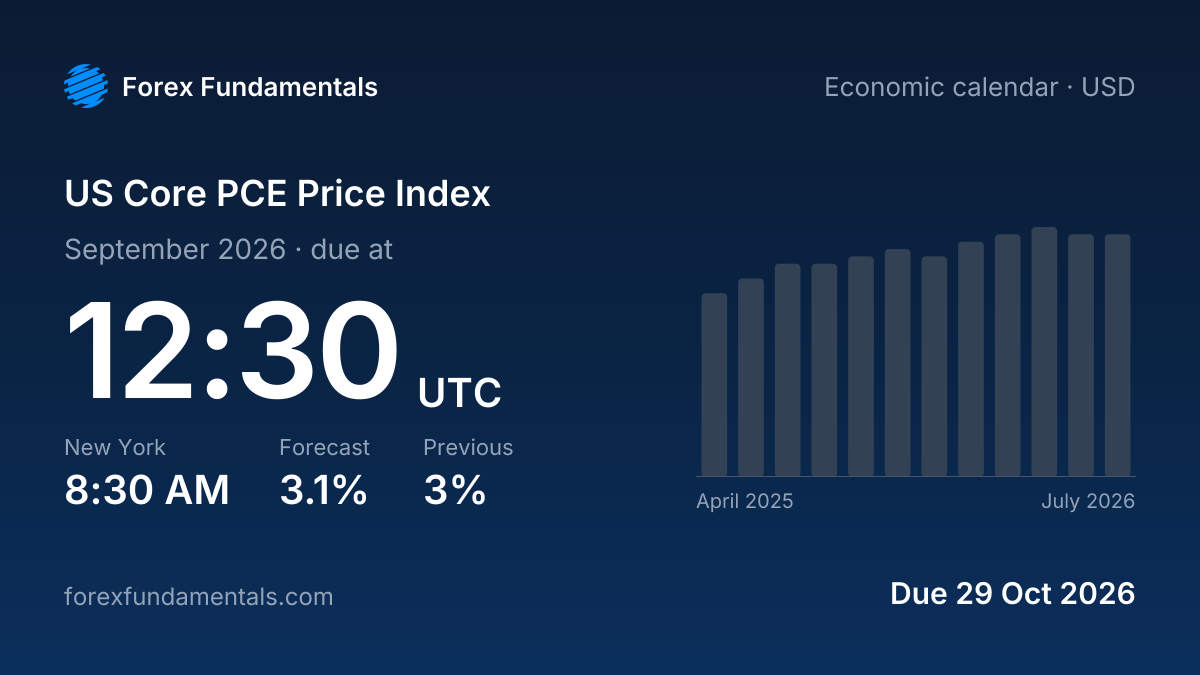
 US Core PCE Price Index 29 October 2026
: the September 2026 figure is due at 12:30 UTC (8:30 AM ET), with a forecast of 3.1%. The last release came in at 3.3% for July 2026 against a forecast of 3.3%, since revised to 3%. Of the last 12 releases, 2 came in above the forecast and 0 below it.
These figures were verified on 23 Oct 2026 from the source: U.S. Bureau of Economic Analysis. This page reports the release as published: the figures, the consensus forecast and what a print like it usually does to the currency.
What a surprise usually does
Above the forecast: An upside surprise usually supports the dollar through higher expected Fed rates.
Below the forecast: A downside surprise usually weighs on the dollar if it points to sustained disinflation.
In line with the forecast: The dollar may be steady, with attention on monthly details and revisions.