
 US Inflation Rate (CPI) 12 May 2017
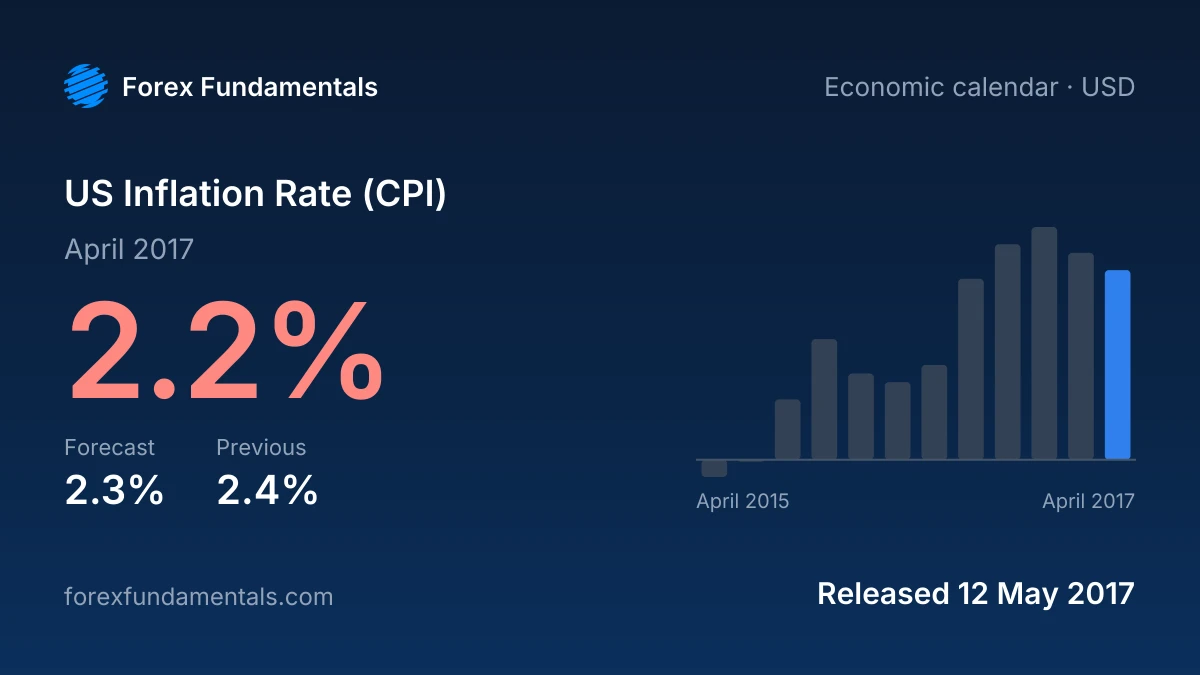
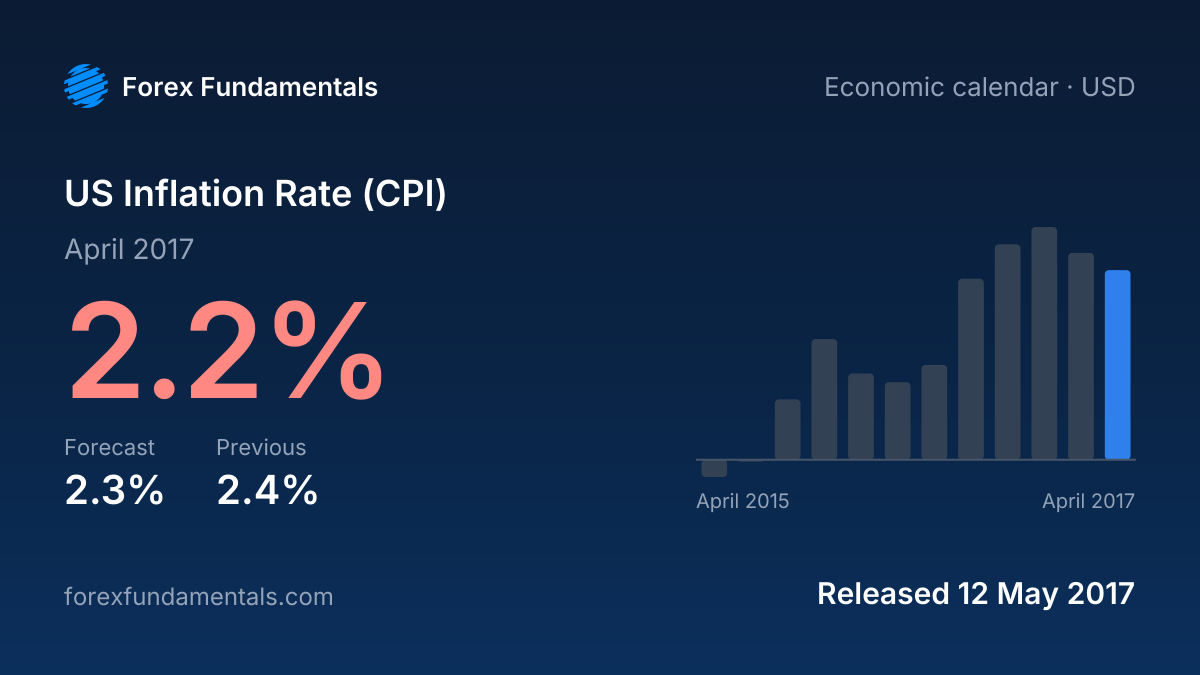
: 2.2% for April 2017, below the 2.3% forecast and down from 2.4% in March 2017. It is the lowest reading since December 2016. It is the second release in a row below the forecast. It was released on Fri 12 May 2017 at 12:30 UTC (8:30 AM ET).
These figures were verified on 4 Oct 2026 from the source: U.S. Bureau of Labor Statistics. This page reports the release as published: the figures, the consensus forecast and what a print like it usually does to the currency.
What a print like this usually does
Below the forecast: A downside surprise usually weighs on the dollar if it reinforces a sustained cooling trend.
Cite this release
If you cite this release, please link to this page:
US Inflation Rate (CPI) 12 May 2017: 2.2% vs 2.3% forecast (U.S. Bureau of Labor Statistics). Forex Fundamentals, https://forexfundamentals.com/economic-calendar/us-cpi/2017-05-12