
 Australia Employment Change 19 October 2017
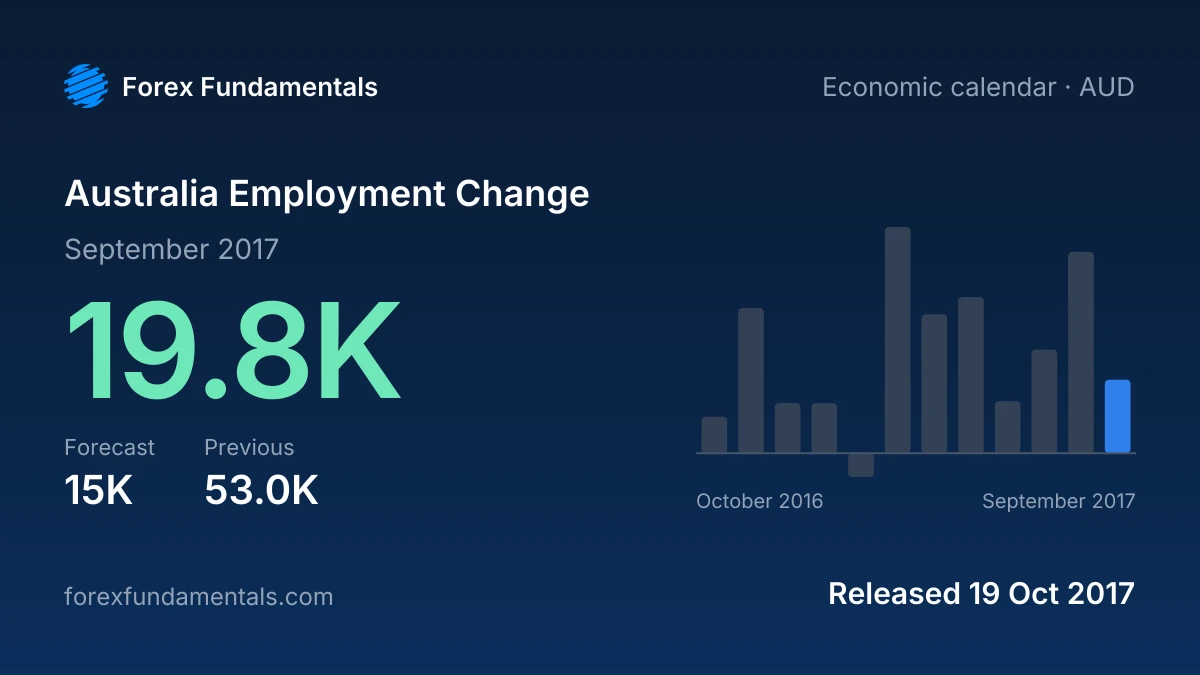
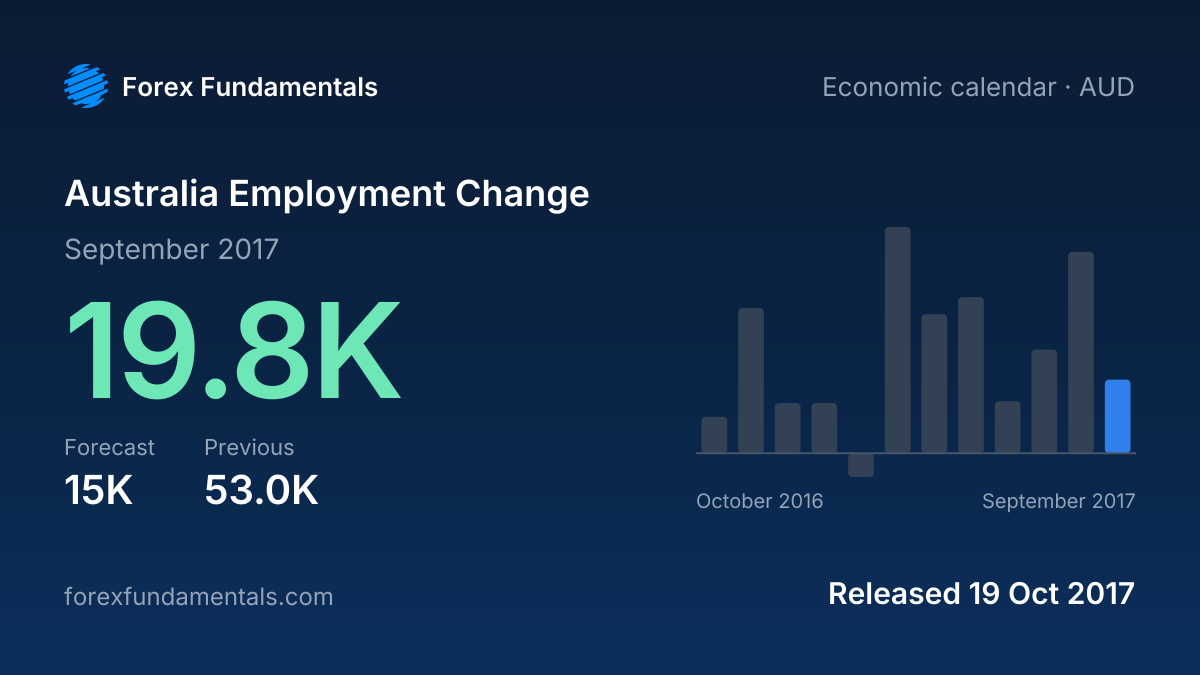
: 19.8K for September 2017, above the 15K forecast and against 53.0K in August 2017 (first reported as 54.2K). It is the lowest reading since June 2017. It is the third release in a row above the forecast. It was released on Thu 19 Oct 2017 at 00:30 UTC.
These figures were verified on 4 Oct 2026 from the source: Australian Bureau of Statistics. This page reports the release as published: the figures, the consensus forecast and what a print like it usually does to the currency.
What a print like this usually does
Above the forecast: A strong employment gain can support the Australian dollar as markets see less reason for the RBA to cut rates, especially if full-time jobs also rise.
Cite this release
If you cite this release, please link to this page:
Australia Employment Change 19 October 2017: 19.8K vs 15K forecast (Australian Bureau of Statistics). Forex Fundamentals, https://forexfundamentals.com/economic-calendar/au-employment/2017-10-19