
 US PCE Price Index 30 May 2025
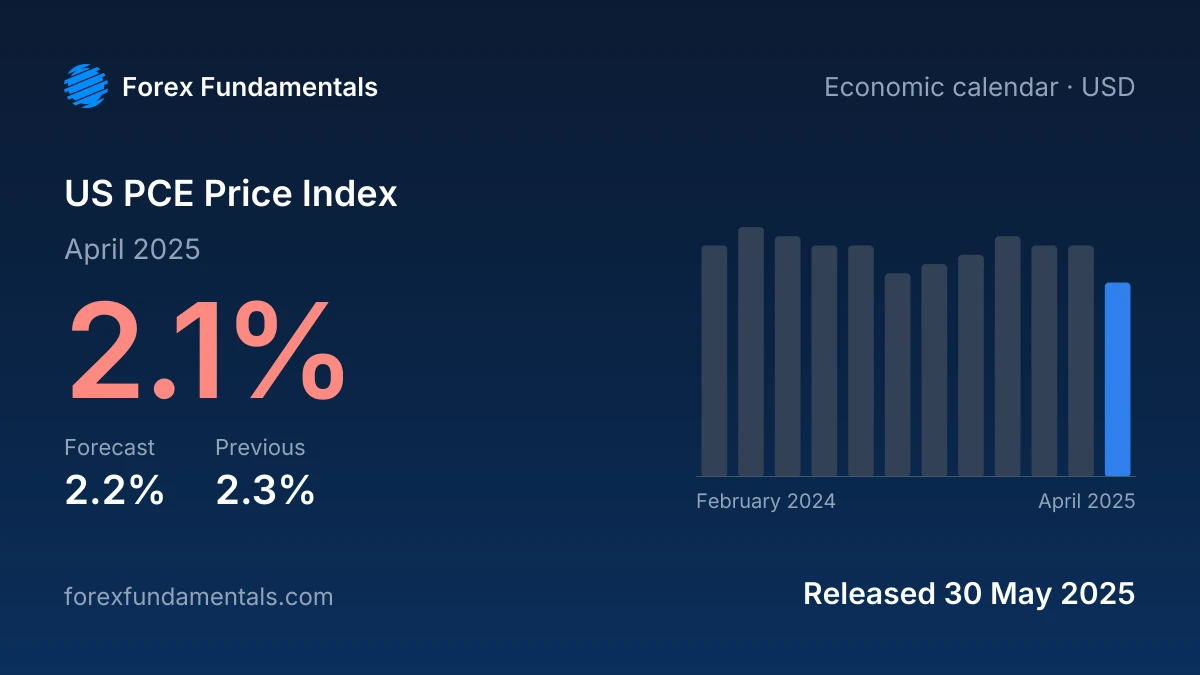
: 2.1% for April 2025, below the 2.2% forecast and against 2.3% in February 2025 (first reported as 2.5%). It is the lowest of the last 12 releases. 4 of the last 12 releases came in below the forecast. Printed 2.1%, above the 2% target. It was released on Fri 30 May 2025 at 12:30 UTC (8:30 AM ET).
These figures were verified on 4 Oct 2026 from the source: U.S. Bureau of Economic Analysis. This page reports the release as published: the figures, the consensus forecast and what a print like it usually does to the currency.
What a print like this usually does
Below the forecast: The dollar can soften as the annual trend appears closer to target and rate cuts look more plausible.
Cite this release
If you cite this release, please link to this page:
US PCE Price Index 30 May 2025: 2.1% vs 2.2% forecast (U.S. Bureau of Economic Analysis). Forex Fundamentals, https://forexfundamentals.com/economic-calendar/us-pce/2025-05-30